


Fall 2022
Read the preceding article here.
A weather-based irrigation protocol allows you to adjust irrigation to meet plant needs by irrigating more frequently in the summer and less frequently in the winter. For the Climate Ready Landscape Plants (CRLP) project, scheduling irrigations is fairly straightforward. All we have to do is paste California Irrigation Management Information System (CIMIS) data into the complex, idiosyncratic Excel spreadsheet we created years ago to simplify the process.

The easiest way to do this is by using a “smart” irrigation controller that connects to local weather and evapotranspiration (ET) sources to pace irrigation frequency. However, if you already have an irrigation controller that doesn’t have this functionality and you don’t want to use a complex spreadsheet like we do (not recommended), the method below offers a way to approximate a weather-based irrigation schedule, which can be entered into an existing controller.
Before proceeding, it is important to note that the steps below are very basic and don’t factor in the context of your site, such as exposure, shading, or plant density. This protocol uses soil composition to inform how much water to apply, with frequency being determined by weather conditions and plant needs.
How Much Water to Apply: Background
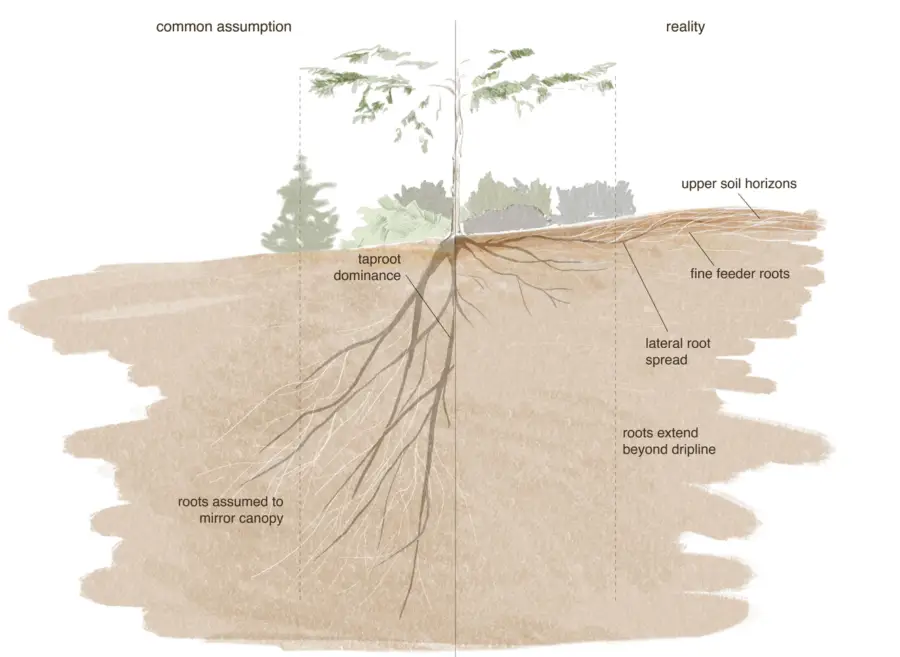
The amount of water that we apply at each irrigation is based on the water-holding capacity of the local soil at each site. Just as there is variation in soils, there is variation in how much water a soil can hold. In general, soils with a higher percentage of clay will hold more water than soils with a higher percentage of sand. However, not all water held in the soil is accessible to plants. While clay soils may hold more water compared to sandy soils, plants cannot extract all of the water in clay soils because it is held so tightly to the soil.
As a result, we focus on the amount of water available to be used by plants, or plant available water (PAW). PAW values can be obtained by submitting soil samples for analysis or from USGS soil survey information. While we initially used data from soil samples at the UC Davis site, in the CRLP project we use values from soil surveys, as this is data a professional or homeowner could access when developing an irrigation schedule. In the soil survey, PAW information is listed as available water storage and expressed as cm per 0–100 cm.

In our protocol, we irrigate when 50% of the wetted area’s PAW has been removed, defining our wetted area as an area around the plan that is 1 meter in diameter and ½ meter deep. This is the volume of soil that the roots of a majority of species could reach over the course of our two-year trial. The use of 50% reflects general landscape practices because water can be drawn down to this value without causing undue stress.
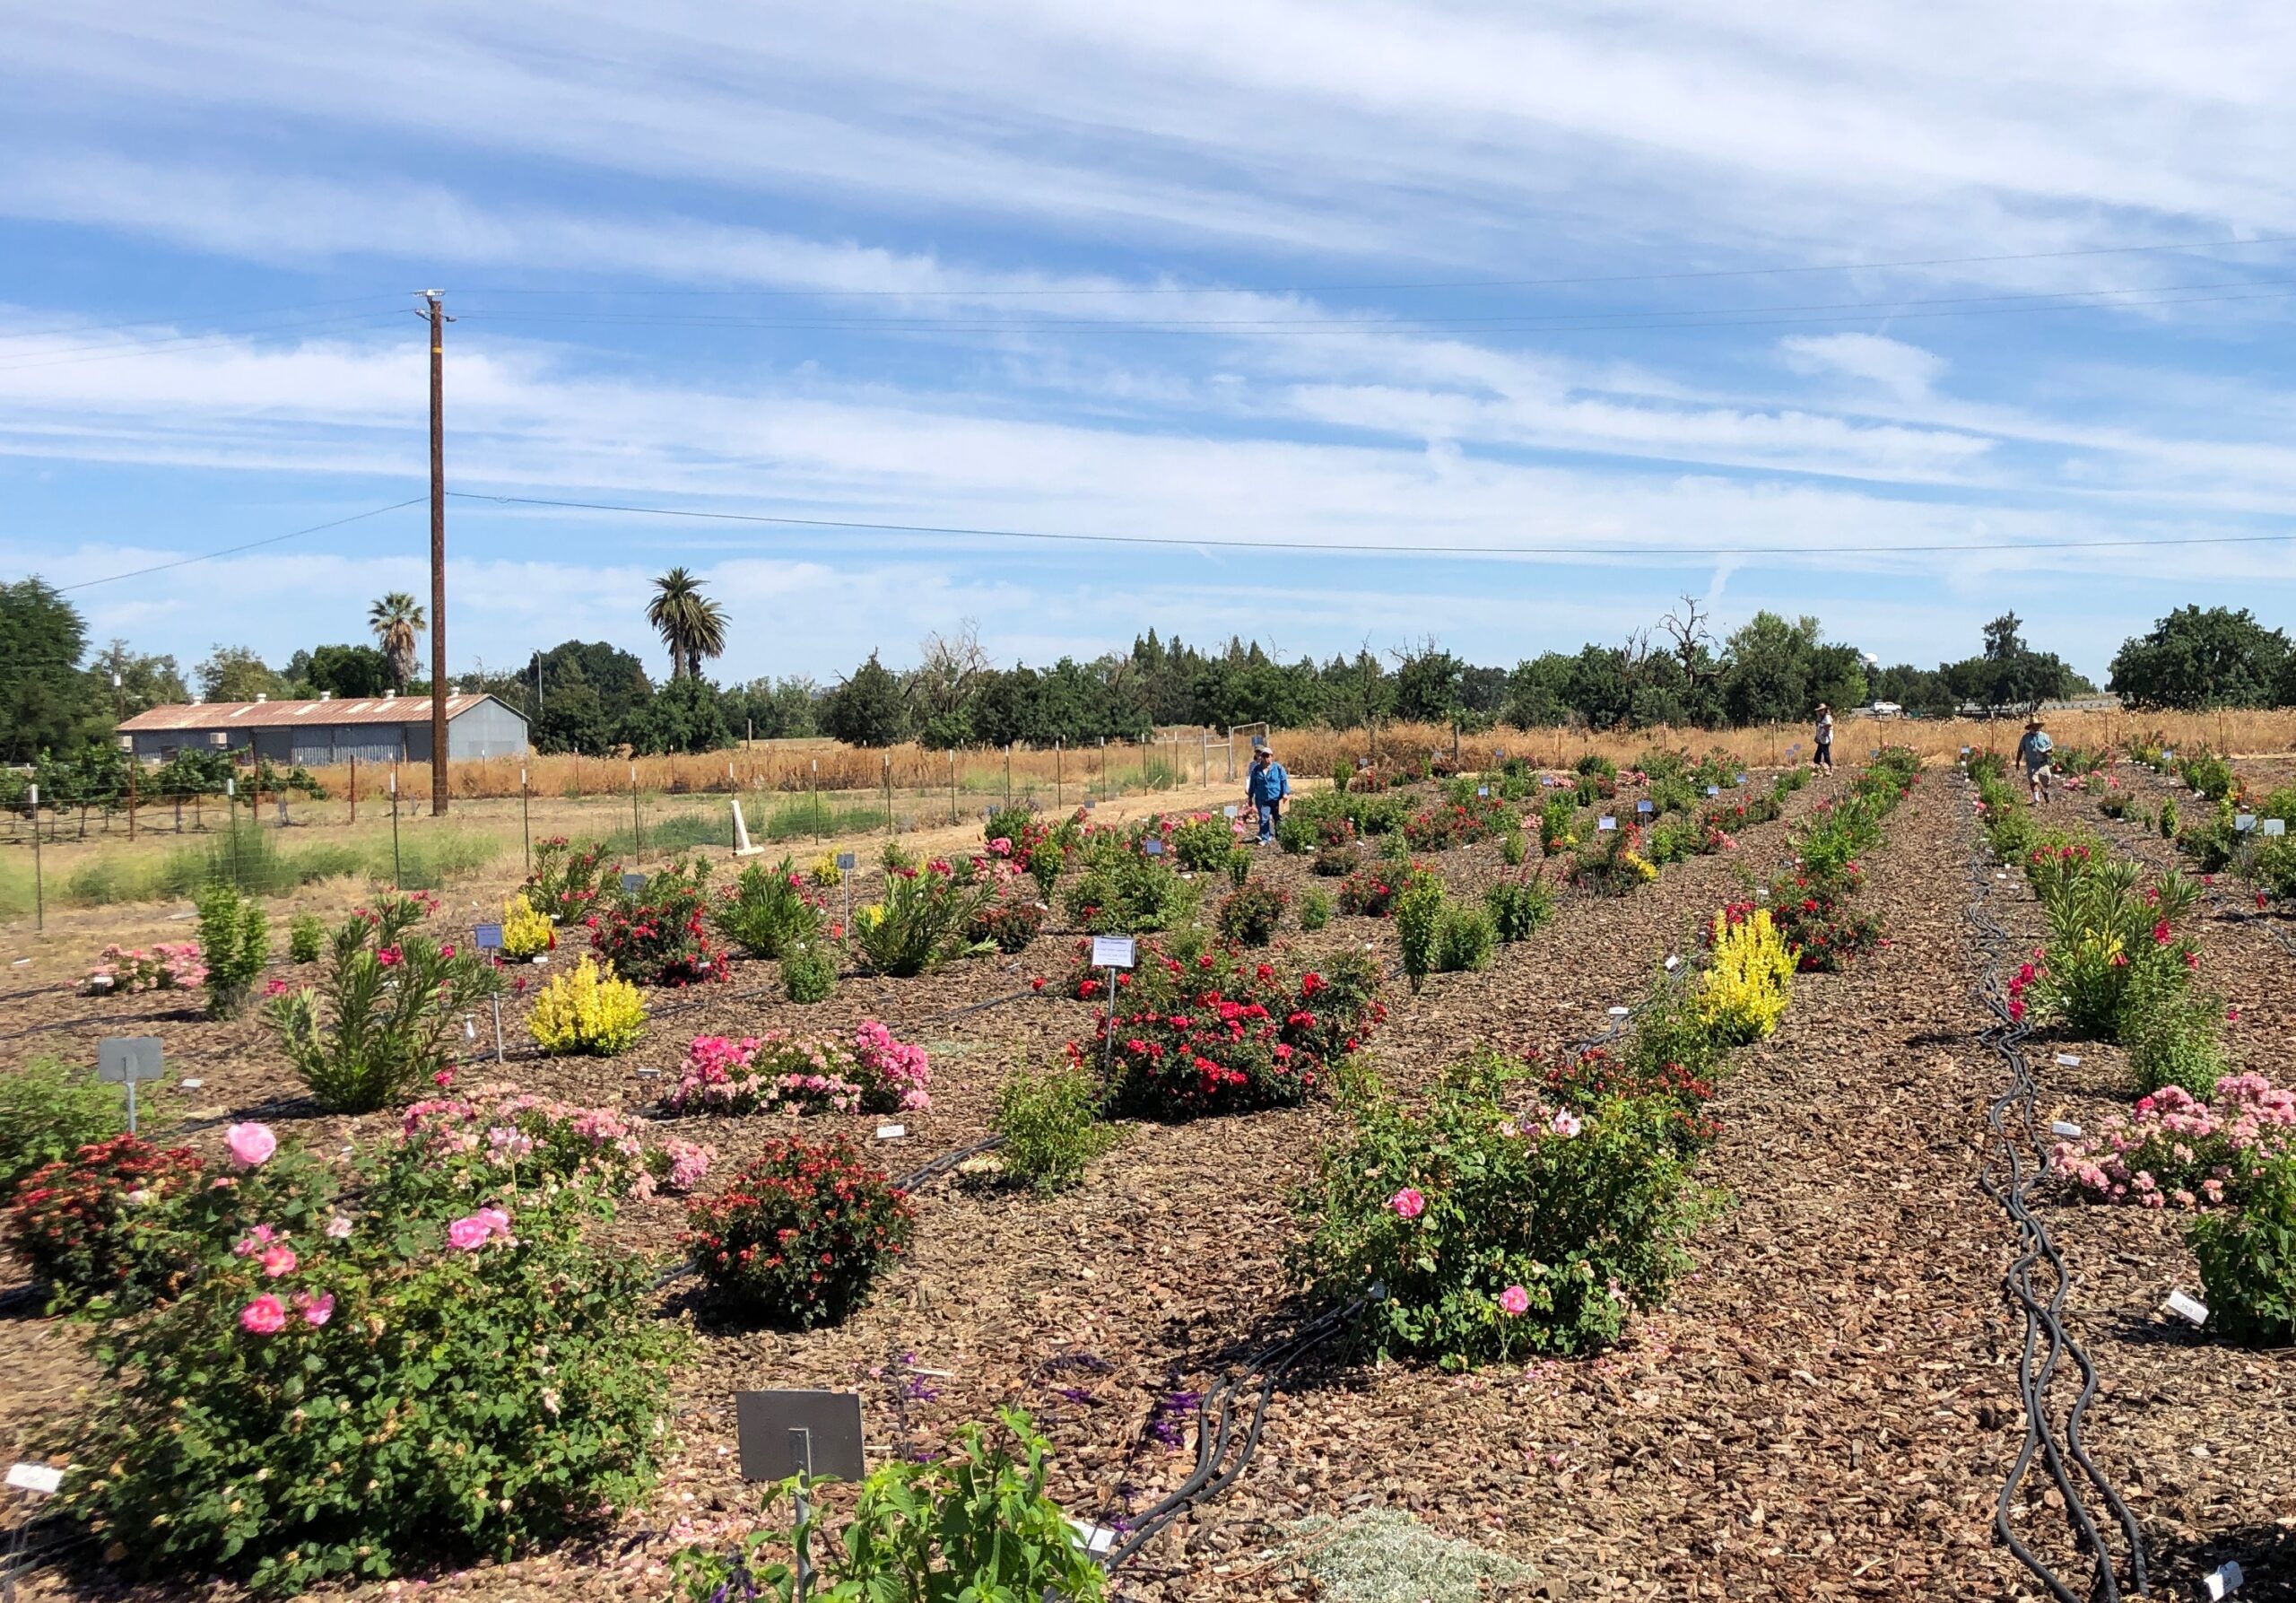
Applying this to our site at UC Davis, our wetted area has a volume of 0.39 m3 or 392.7 L, with available water storage of 18.71 cm per 0–100 cm, which—interpreted as a percentage—results in plant available water of 73.47 L (392.7*0.1871), or 19.41 gallons. At each irrigation, we would apply 50% of PAW, which is 1.84” or 9.7 gallons, to replace the 50% of PAW that was lost as ET. Because ET varies with the season, the frequency of irrigations will vary, but the amount applied at each irrigation is the same.
How Much Water to Apply: Process
Navigate to SoilWeb, find your location, and identify the plant available water for your soil, which is listed as available water storage under the Map Unit Data menu. Since the units for this category are 0–100 cm, it could also be expressed as a percentage for easy transfer to inches. For Davis, 18.71% of each 12” of soil is PAW, which is equal to 2.24”. If you were to irrigate when 50% of PAW was removed, this number would just be divided by 2, so 1.12” would be both the amount of water that you would apply and the amount of ETo you would accumulate before irrigating. Once you have estimated your PAW based on how deep you intend to irrigate, the next question is how to schedule irrigations.
How to Schedule Irrigation: Background
Key to this protocol is the measurement of evapotranspiration (ET), which is the amount of water evaporating from the soil or transpiring from plants. In California, we obtain ET information from the California Irrigation Management Information System (CIMIS), a network of weather stations located all over the state. ET is typically reported in inches. Because ET can vary from species to species, it is expressed in relation to a reference crop. CIMIS stations are located in a plot of cool-season turf, the reference crop, and ET is reported as ETo, with the subscript signifying that it is the observed ET of the reference crop. For example, CIMIS Station #6 in Davis, CA reported an ETo value of 0.22” for 10/23/22, which means that 0.22” of ET occurred from the plot of cool season turf from 12:00 a.m. to 11:59 p.m. While ET is generally impacted by the temperature and day length, wind—both wind speed and wind run—can greatly increase ET values.
The frequency varies in our protocol because ET varies throughout the year, being highest in the summer and lowest in the winter. During our irrigation season, typically from April to October in Davis, we will record ETo values daily until 50% of PAW or 1.84” is accumulated, after which we irrigate.
Since this project is an irrigation trial, we implement our deficit irrigation treatments are by modifying ETo rather than adjusting the amount of water applied. Since ETo is the amount of ET occurring in the reference crop, this strategy is predicated on the rationale that plants in the trial are using water at a lower rate than the cool-season turf reference crop. As a result, the percentage associated with each treatment—80%, 50%, or 20% of ETo—effectively functions similarly to a crop coefficient. A crop coefficient functions as multiplier that allows you to interpret the ET from the reference crop, the cool season turf, to your own plants. If you had a crop coefficient of 80 percent of ET for your plants, that would mean the ET of your plants is only 80 percent of the reference crop.
Using the 0.22” ETo from 10/23/22 mentioned earlier, the 80% treatment would record that only 0.176” of ET had occurred (0.22” x 0.8), with 0.11” and 0.044” recorded for the 50% and 20%, respectively. Thus, the 80% treatment will accumulate ET much more quickly than 20% treatment, be irrigated more frequently than the 20% treatment, and receive more water over the deficit season than the 20% treatment.
How to Schedule Irrigation: Process
First, visit CIMIS or your local CIMIS equivalent and obtain the average monthly ETo and rainfall for your site. For example, data for our site in Davis is as follows:
| Jan. | Feb. | Mar. | April | May | June | July | Aug. | Sept. | Oct. | Nov. | Dec. |
| 1.55 | 2.24 | 3.72 | 5.10 | 6.82 | 7.80 | 8.68 | 7.75 | 5.70 | 4.03 | 2.10 | 1.55 |
Data taken from CIMIS ETo Zone 14. Credit: California Department of Water Resources, 2012
We recommend breaking the year into three to four groups with similar ETo values to minimize the frequency of re-programming the controller. We can break this data into three seasons based on the values:
| Season | Months | Total ETo in period | # of Days in period | Mean ETo/day |
| Winter | November
December January February |
7.44 |
120 |
0.062 |
| Spring/Fall | March
April September October |
18.55 |
122 |
0.153 |
| Summer | May
June July August |
31.05 |
123 |
0.253 |
Next, estimate what percentage of ETo the plants in each of your hydrozones use relative to the reference plant. This is equivalent to our protocol of assigning each plant either an 80%, 50%, or 20% treatment. In California, we recommend accessing the Water Use Classification of Landscape Plants (WUCOLS), which assigns a percentage of ETo to plants at a genus, species, or cultivar level.
As a reminder, each hydrozone needs to be irrigated to the “thirstiest” plant. If there are 11 plants in the zone, with 10 listed as 10–30% and one listed as 40–60%, that entire zone will have to be irrigated at 40–60% which is not the most efficient use of water.
Once you determine the percentages of ETo for each zone, you can multiply these percentages against the mean ETo/day to estimate the ETo/day for each zone. If you then divide 50% of PAW by this value, you can determine the frequency or the days between irrigation. Continuing with our Davis example, if we had a zone irrigated at 50% of ETo it would accumulate 0.126” of ET every day in the summer (0.253*0.5) and need an irrigation roughly every 14 days (1.84/0.126). At the beginning of May, we could schedule the controller to irrigate every 14 days, reduce to every 24 days in September, and then every 60 days in November. It is also important to look at your historical precipitation patterns. We in Davis have typically stopped irrigating during the rainy season from November to February, only turning water on during drought years.
While I hope these steps provide some guidance, remember that each irrigation program needs to account for the variation and complexity of its site. For example, all of our plants are grown in full sun with no trees or buildings casting shadows, allowing each treatment to be its own hydrozone. We don’t have to deal with overcrowding, since all of our plants are spaced 2 meters apart in a grid. As a result, it is important to ground truth the irrigation program you develop. Use a soil probe or small shovel to verify that water is reaching its intended depth in the soil profile, assess plants for signs of stress, and adjust your program in response. While this is much more complex than the past practice of just setting a controller to turn on multiple times per week, this should result in resilient, water-efficient landscapes.
Resources
This guide mentions the web tools SoilWeb, and WUCOLS, while ET zone maps and historical weather data for California can be found at California Irrigation Management Information System (CIMIS).The Irrigation Innovation Consortium links the ET networks for several other states.
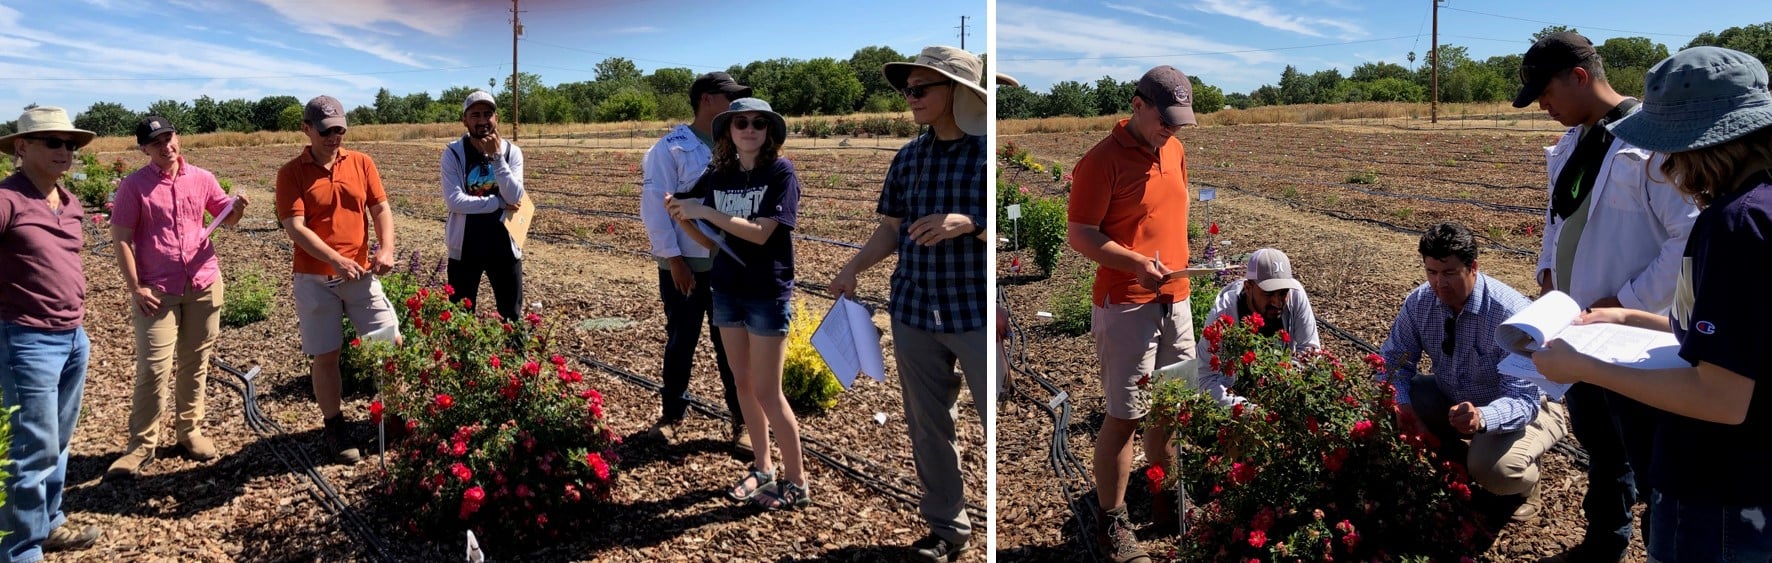
For more information on the featured irrigation project, see the Climate Ready Landscape Plants (CRLP) project.
This content was made possible in part by The Saratoga Horticultural Research Endowment (SHRE).


Design Futurist Award Announced: Committee Shares Vision
March 8, 2023 At Pacific Horticulture, we believe that beauty can be defined not only by gorgeous plants and design, but also by how gardens
Expand Your Palette: Waterwise Plants for your Landscape
There’s nothing more thrilling to plant lovers than discovering new plants to test in the garden. Here in the southernmost corner of California, we have
What Climate is This? Part Two – A Garden Futurist Special
Winter 2022 Listen to the Part 2 Podcast here. If you live in the Pacific region, you know that seasons in your garden look different
Portland Parks’ “Nature Patches”
Winter 2022 Nature is so beautiful when left to its own devices, yet crisply manicured lawns remain a status symbol. This is true in Portland,
Responses